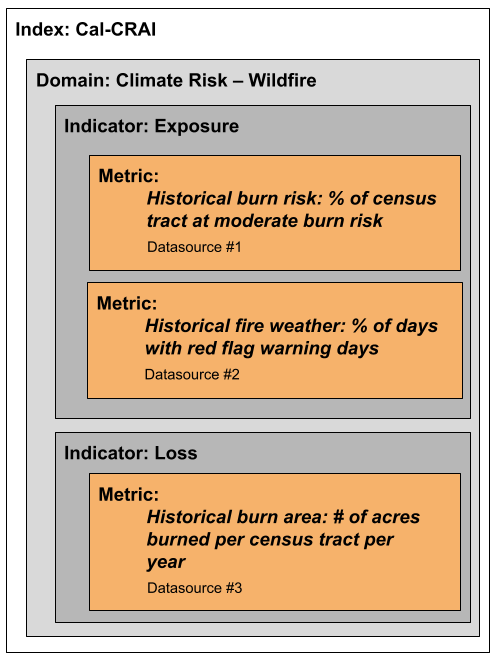
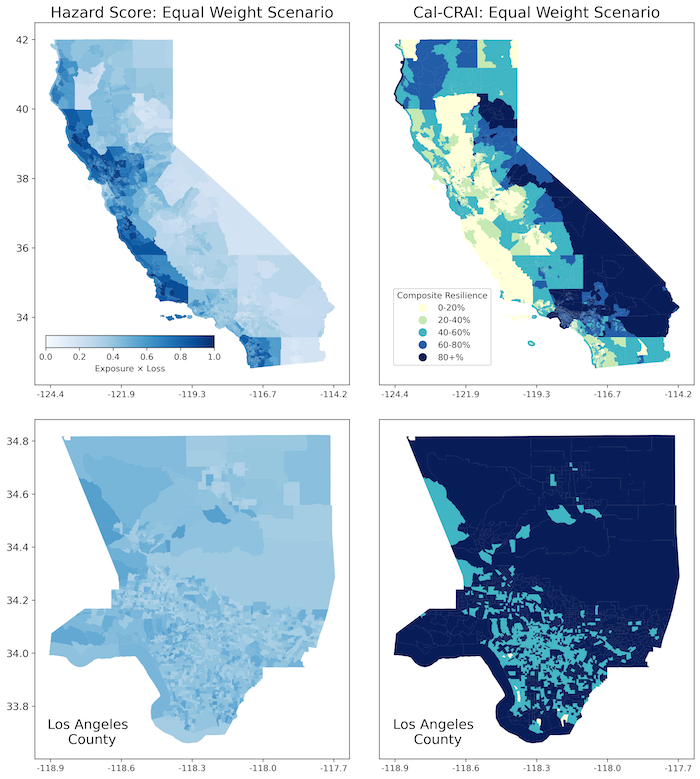
Eagle Rock Analytics developed a novel index to quantify the co-benefits of California Climate Investment (CCI) projects for the California Air Resources Board. The California Climate Risk and Adaptation Index (Cal-CRAI) is a co-developed measure to quantitatively evaluate connections between California-specific climate risk needs, resilience indicators, and adaptation efforts undertaken by communities. Cal-CRAI evaluates both community capacity (the ability to adapt to and recover from climate events) and hazard risk (exposure to specific climate hazards and associated historical losses from such events). The Cal-CRAI evaluates the following hazards: wildfire,extreme heat,in-land flooding,drought, and sea level rise.
CCI programs are designed to reduce greenhouse gas emissions while providing socioeconomic, health, and ecosystem benefits within disadvantaged and low-income communities across California. The Cal-CRAI incorporates a comprehensive range of socioeconomic, built environment, governance, and natural environment indicators, and generates a composite resilience index score that integrates these assessments. The Cal-CRAI can also provide agencies with detailed information to prioritize climate adaptation as a critical objective when designing future programs, planning projects, selecting grant awards, and more.
This work is supported by California Air Resources Board grant 22STC003.
Code publicly available: https://github.com/Eagle-Rock-Analytics/carb-climate-index